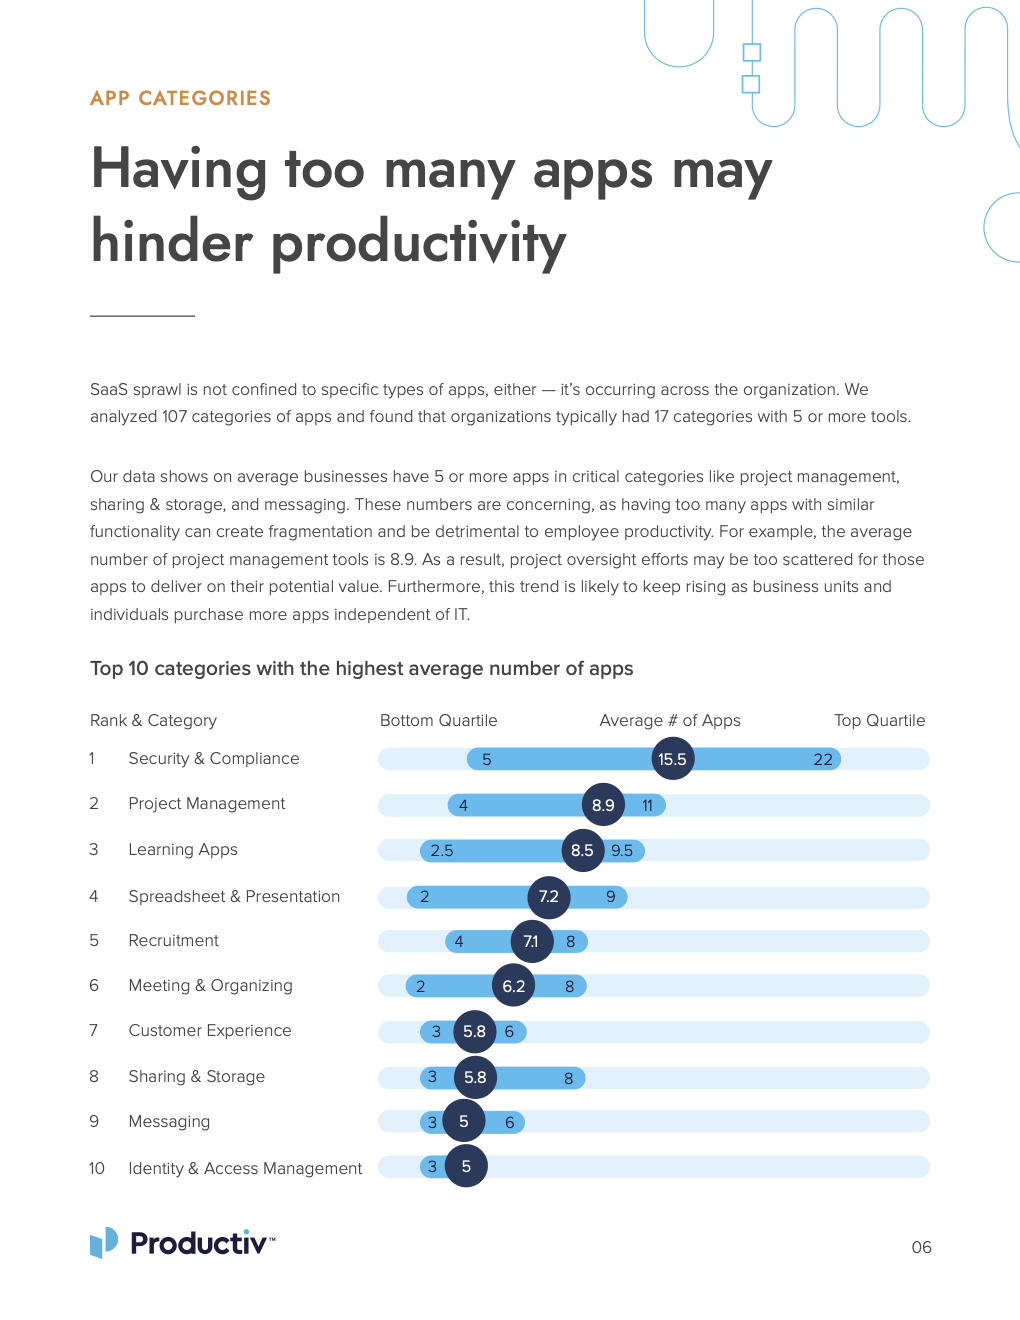
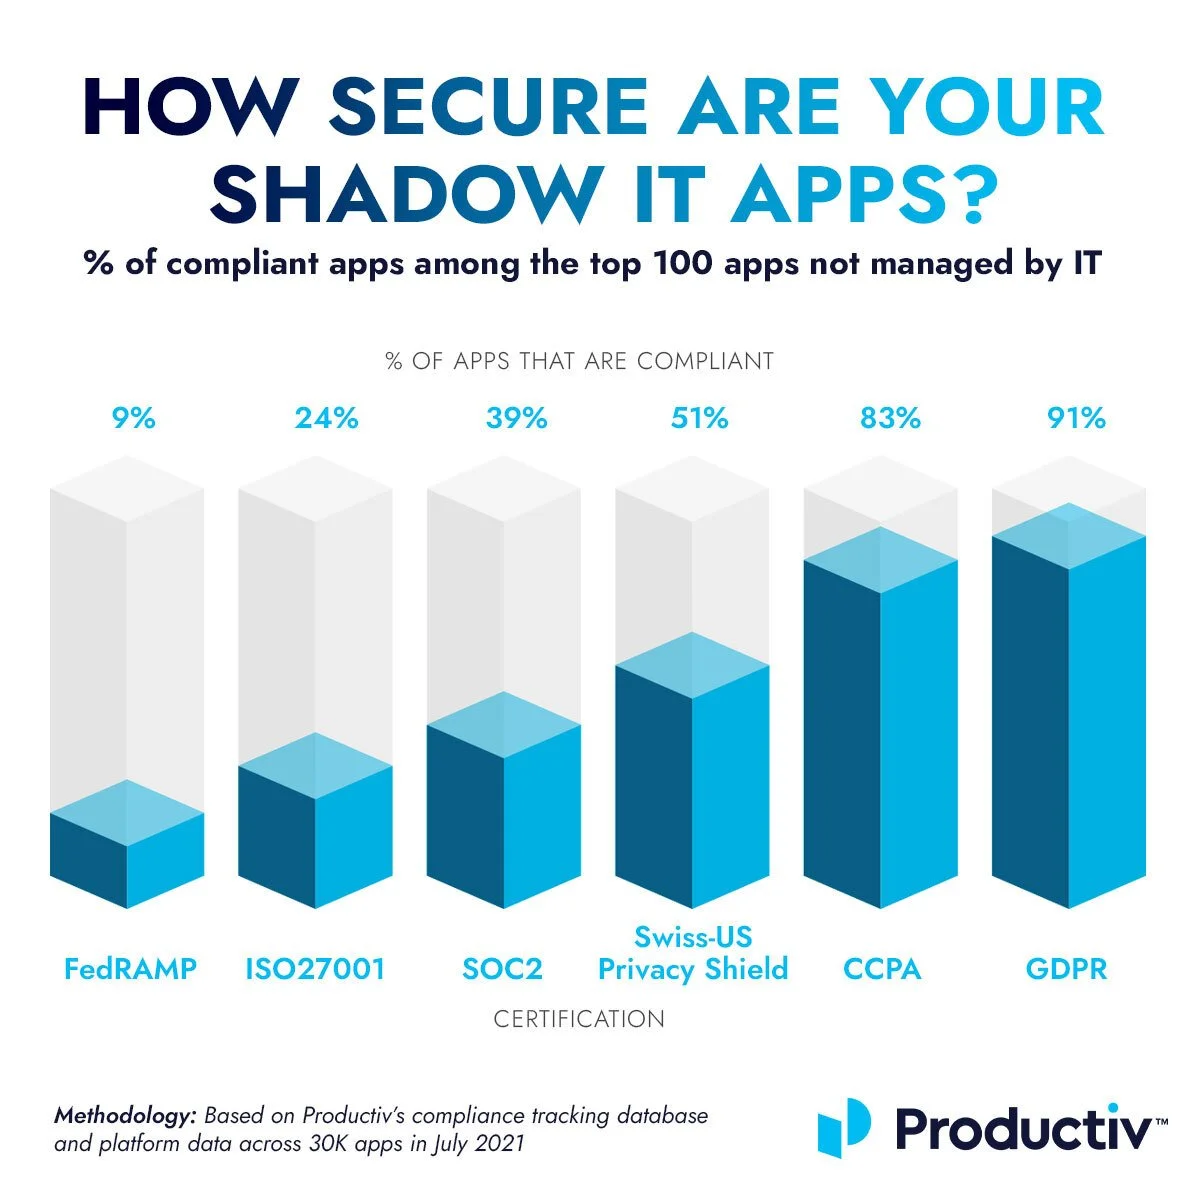
This eBook was Productiv’s first foray into an annual report featuring proprietary data. It was so successful that we saw 300+ downloads within the first few months of launch, and was the basis of 10 or more media/news coverage pieces across B2B tech sites.
I proposed the idea, came up with the campaign strategy, led the project, managed the timeline, and created all of the content (aside from the raw data and analysis). I also worked very closely with a design agency on the format and data visualizations.
At StarTree, we covered both customer case studies and open source user stories. The FinTech company Stripe is one of the largest users of the open source project that StarTree’s product is based on, and I had the opportunity to craft this in-depth user story leveraging recorded meetups.
I wrote all of the content for this user story, and collaborated closely with our on-staff designer on the original graphics and design elements. I also led the project for the video testimonial that is featured toward the top of the page (which was captured at StarTree’s industry conference).
Qubole’s marketing team developed a new campaign to showcase the advantages of our product against competitors. I wrote and developed this white paper as a way to discuss those benefits while also incorporating detailed technical information and customer success stories.
I created the content included in this white paper by mixing existing internal content, original content that I wrote, company anecdotes, and customer proof points. I then worked with my boss and a freelance designer on the design and visual concept of the white paper.
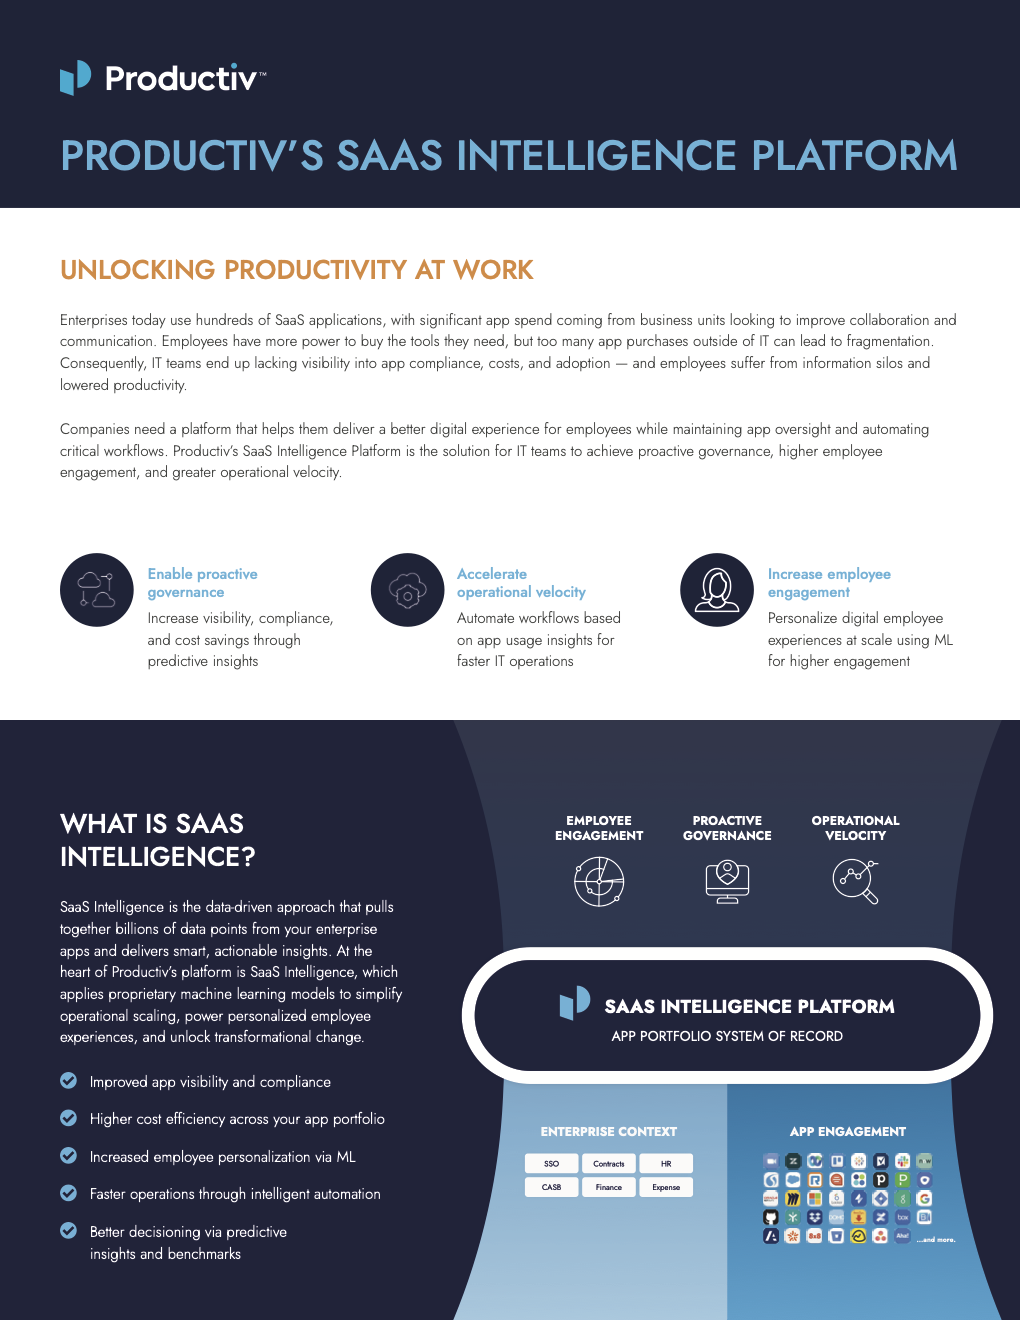
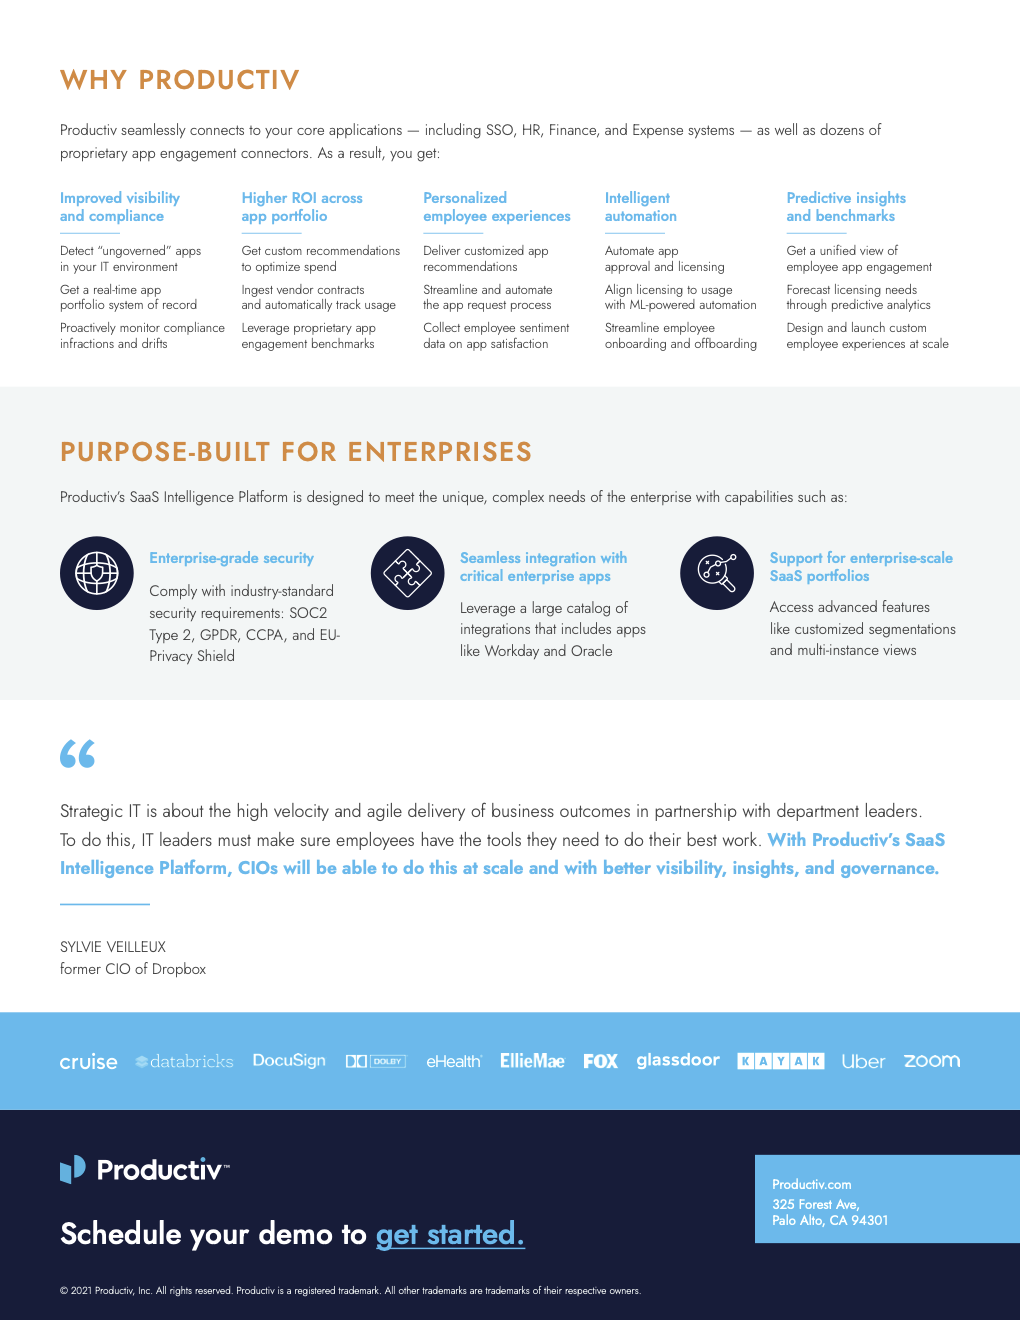
At Productiv, I was heavily involved in the development of product marketing assets. This data sheet needed to be developed for a major rebranding of our core SaaS product, and I was tasked with creating the content.
For this data sheet, I collected content from the Director of Product Marketing and blended information from some of our pre-existing marketing assets. I also revised the content as needed to meet the formatting limitations.
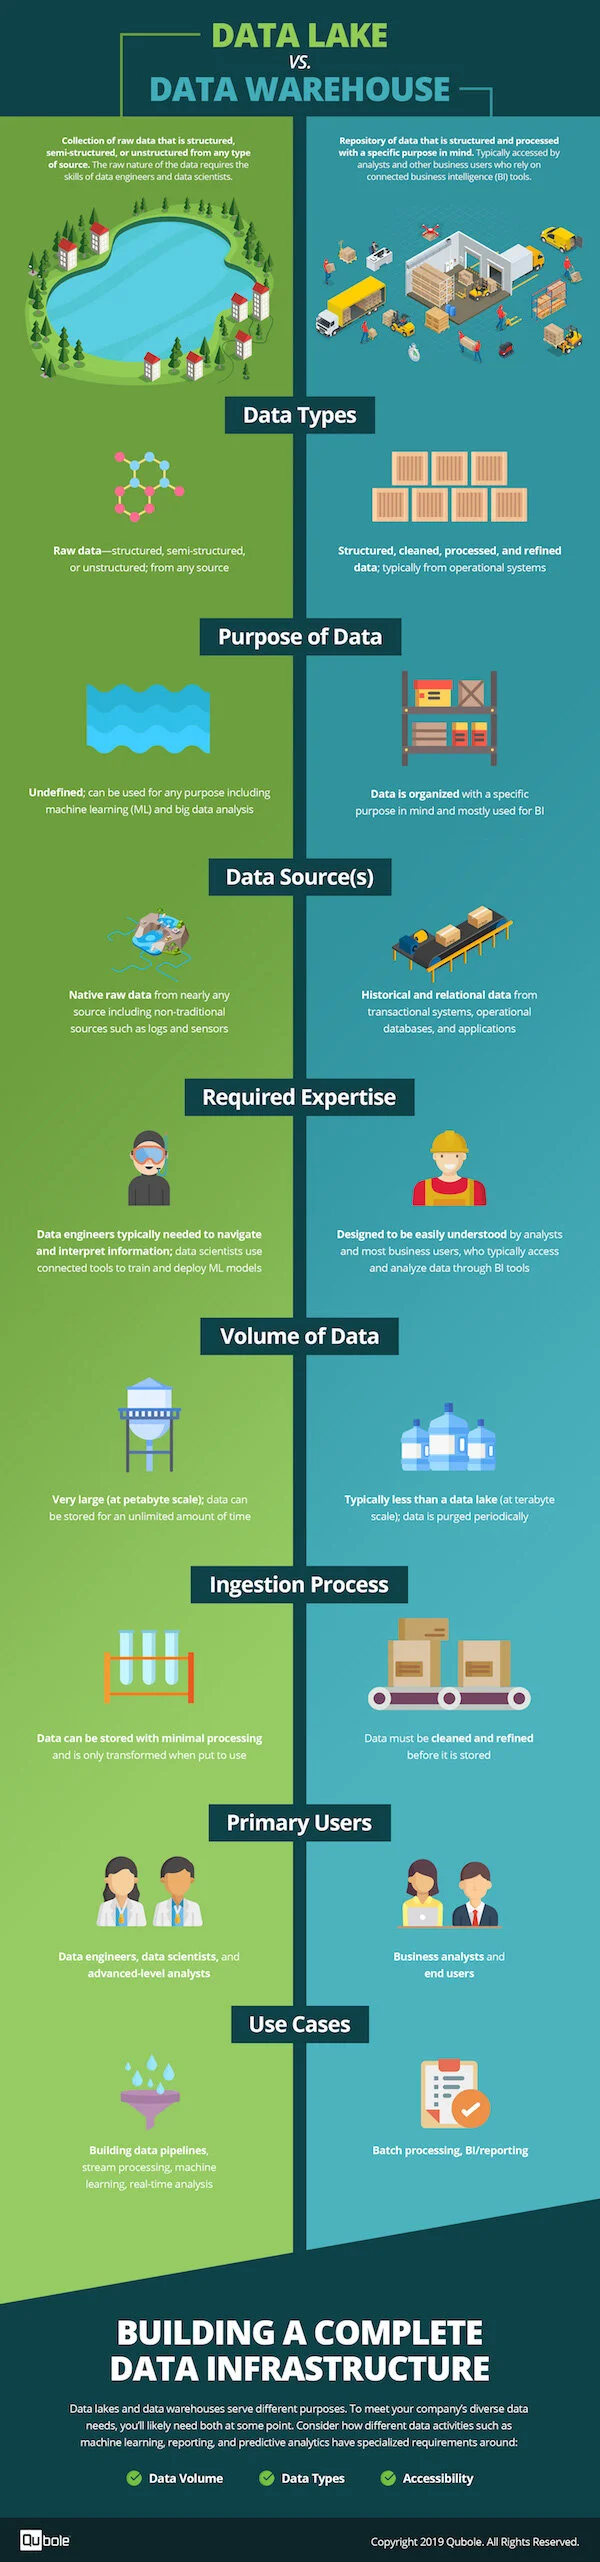
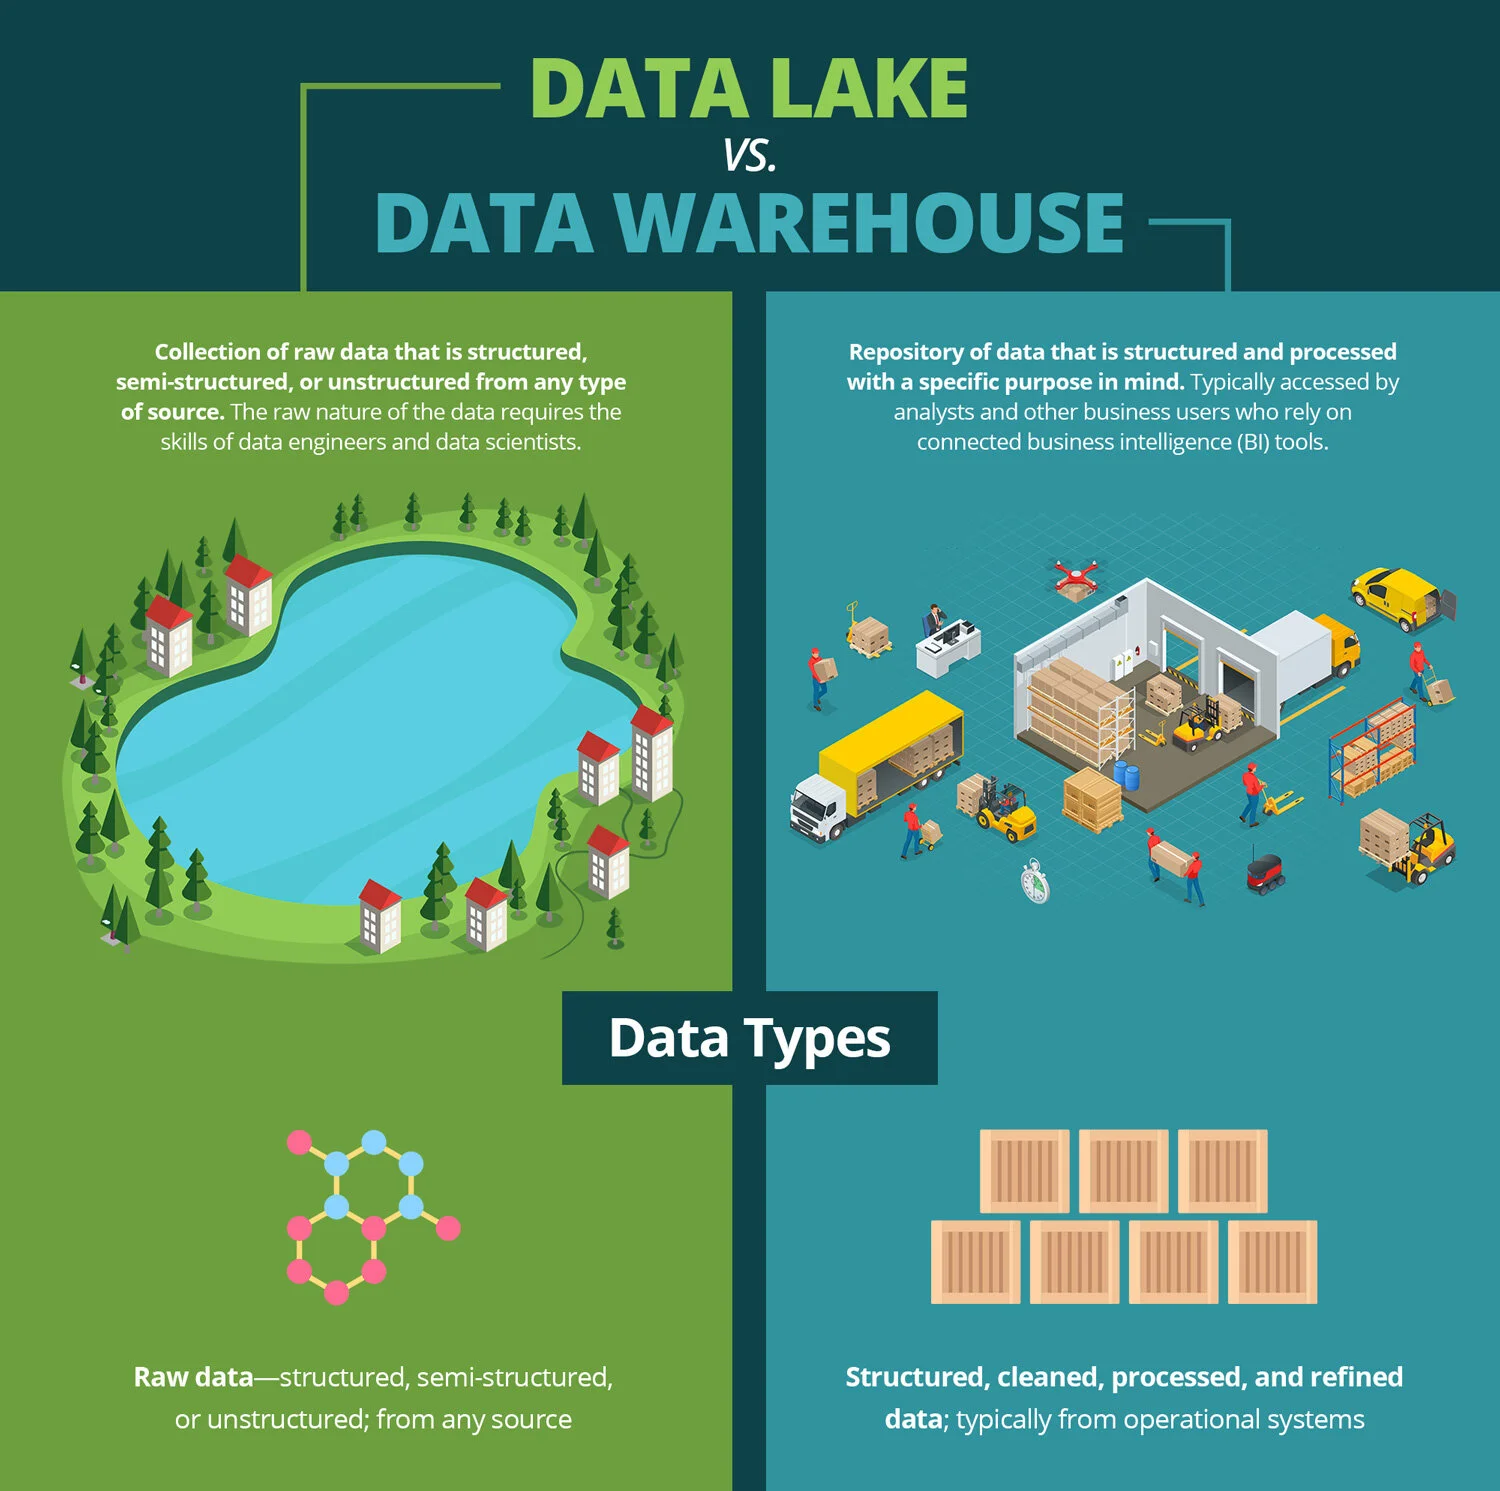
In conjunction with a third-party digital marketing agency, I led the development of a new infographic for Qubole about key differences between data lakes and data warehouses. My aim was to make the content more nuanced than a traditional “x versus y” approach.
During development, I worked with internal experts to ensure the content conveyed the information accurately. I then crafted a blog about debunking data storage myths to accompany the infographic.
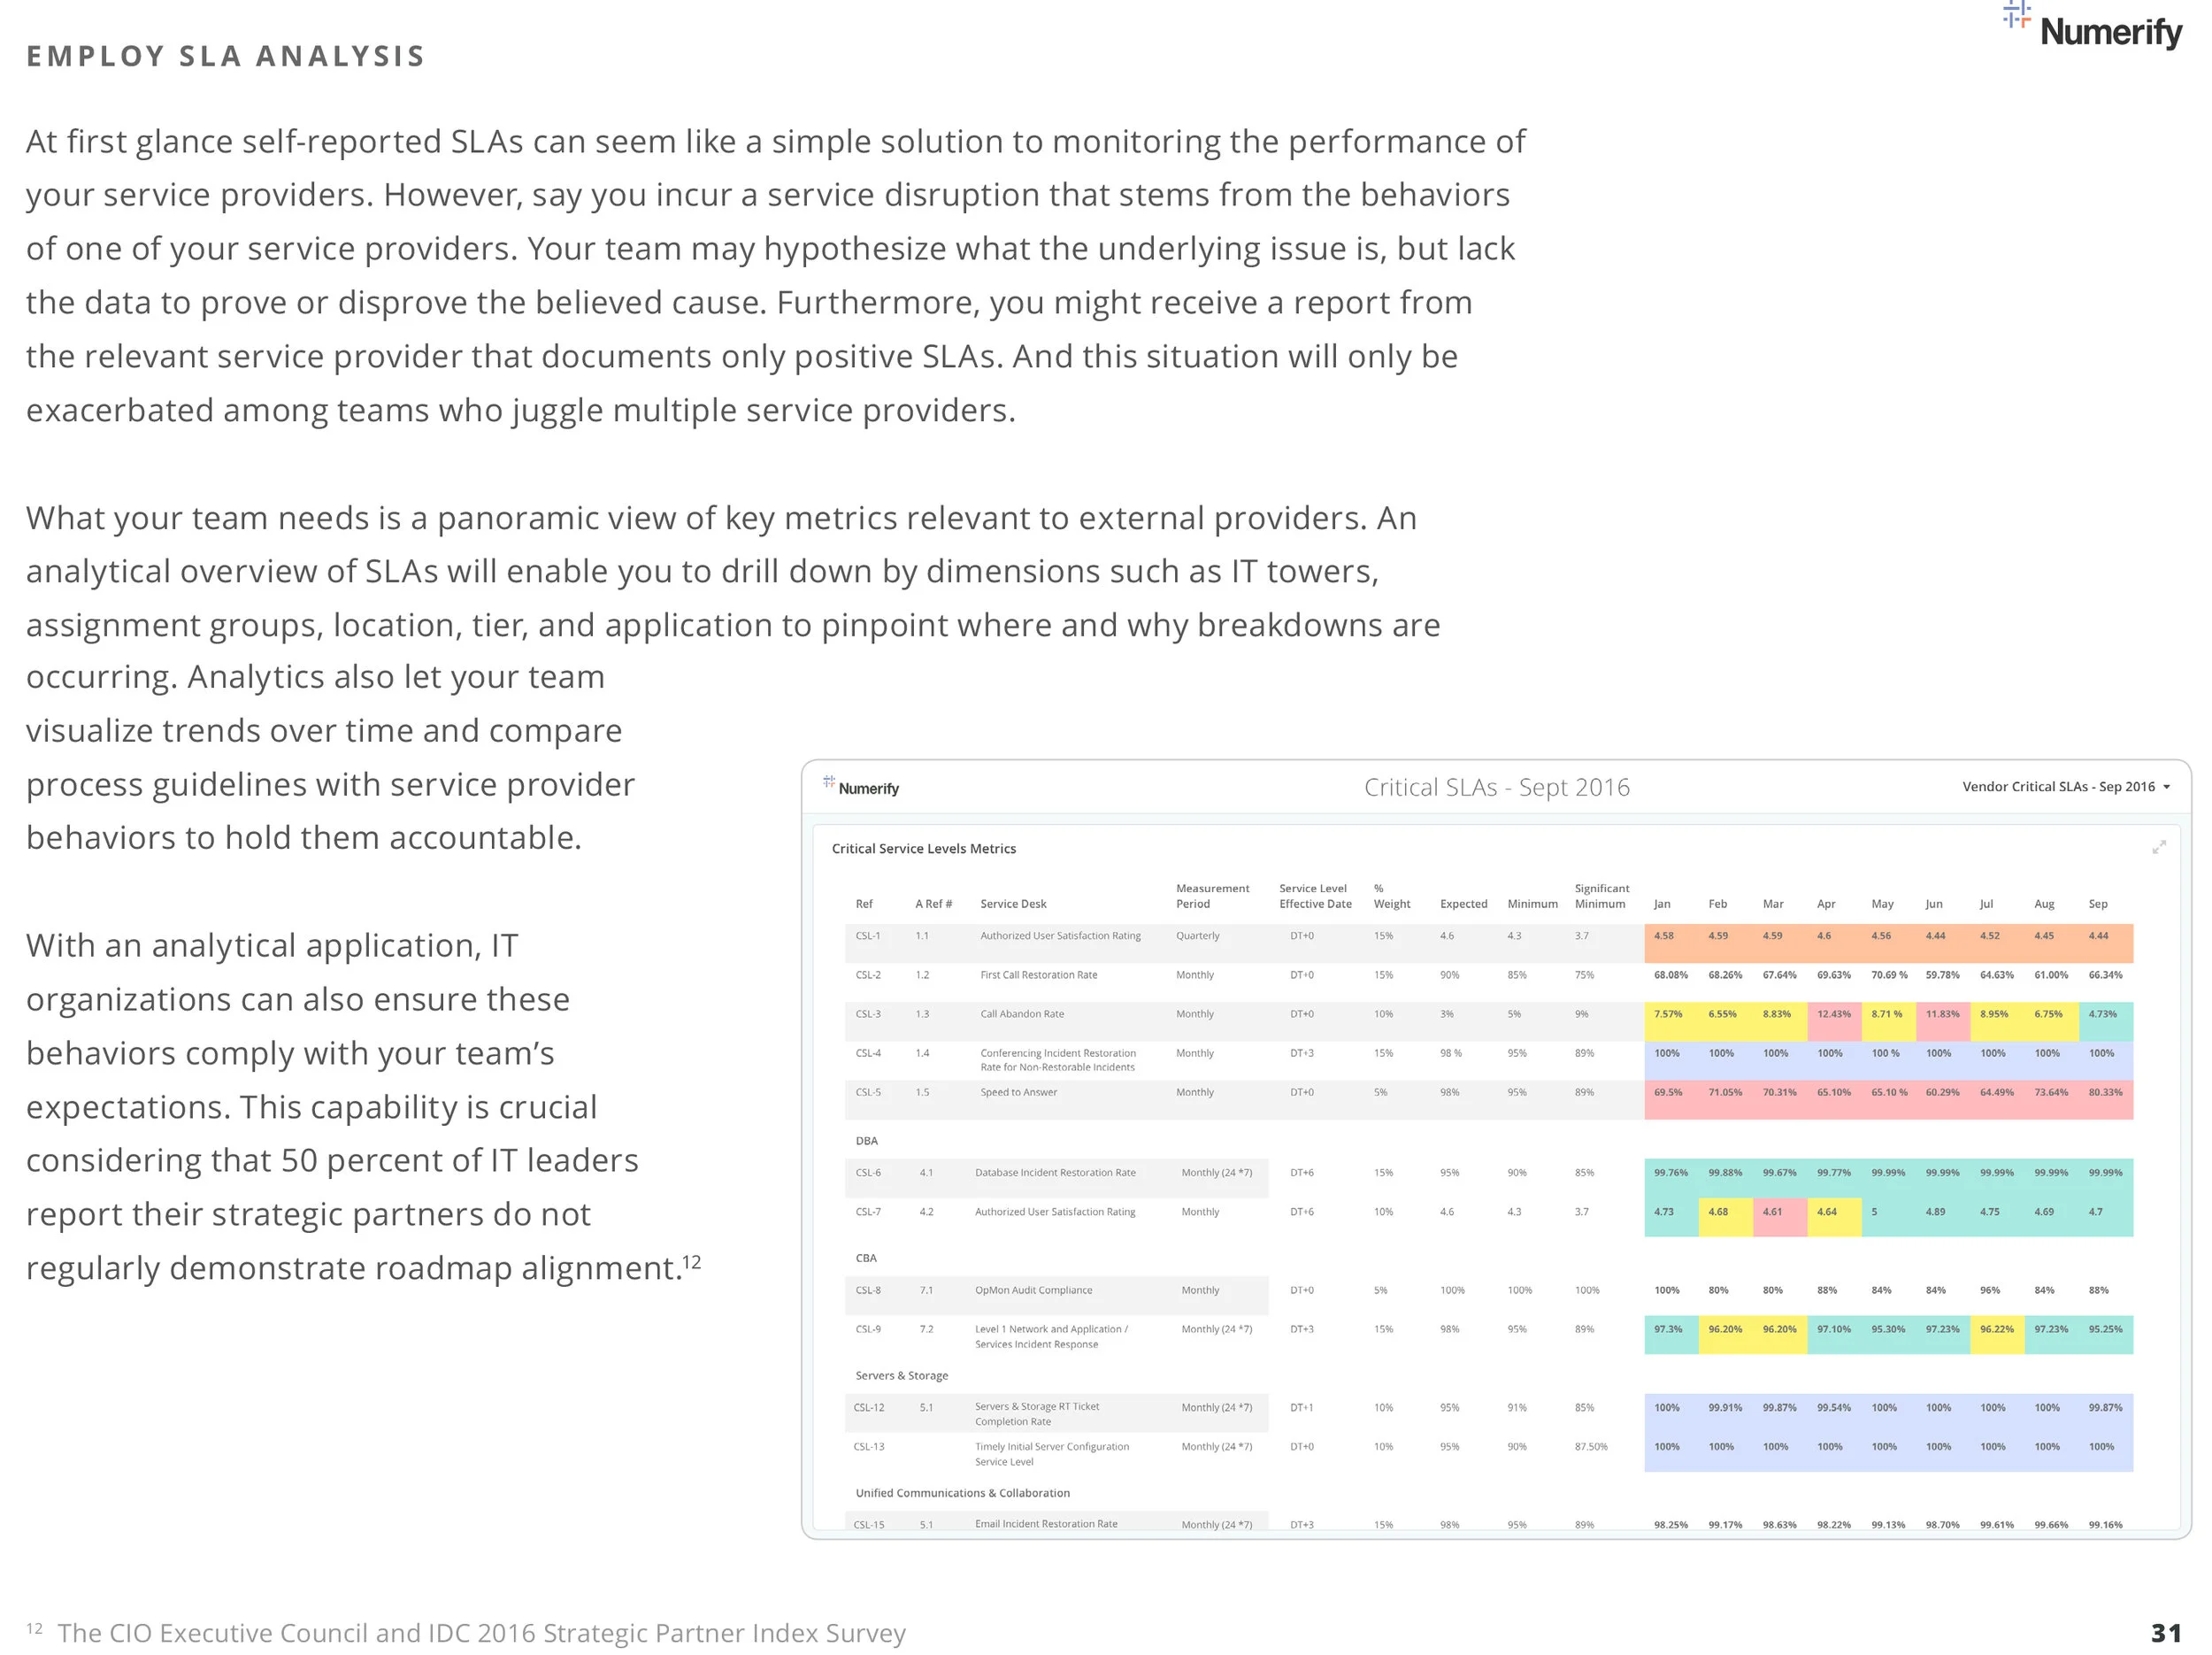
For the launch of a new product, I worked with Numerify's Director of Product Marketing to develop and refine copy that highlighted the key functionality of the new application. My role also included ensuring grammatical consistency throughout the copy and tightening the messaging for clarity and aesthetic purposes.
In addition, I built and formatted the page in WordPress using our back-end visual editor and a mockup provided by our designer.
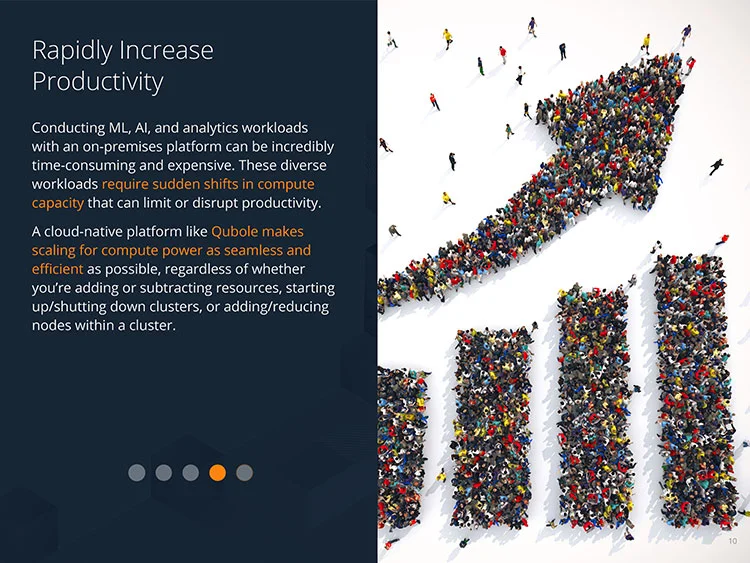
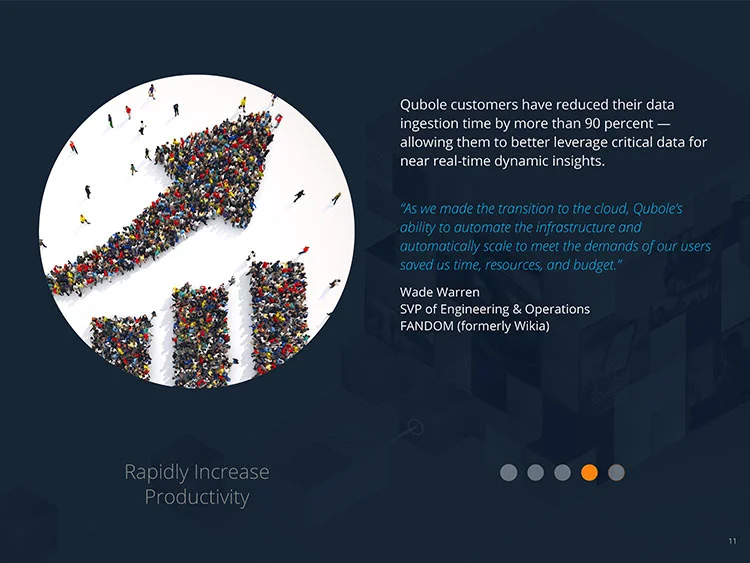
As the Content Factory Marketing Manager at Qubole, part of my job was to create original assets highlighting our data platform’s unique value. This corporate eBook was one concept I came up with as an easily digestible and visually appealing asset to share Qubole’s key value differentiators.
I developed the concept as well as all of the written content featured in this guide. I worked directly with a contract designer on the design to ensure the format and quality of design met company expectations.
I have worked on several use cases for Numerify, including this anonymized version that highlights the value one of our customers has achieved. To develop the content, I interview one of the customer's employees who utilizes Numerify within their IT organization. I then craft and refine a storyline based on this conversation.
Typically I go through a round or two of content editing with our customer prior to publication. I am also responsible for building out the web page that features the use case, a page design that I tweaked to look cleaner and better showcase the content.
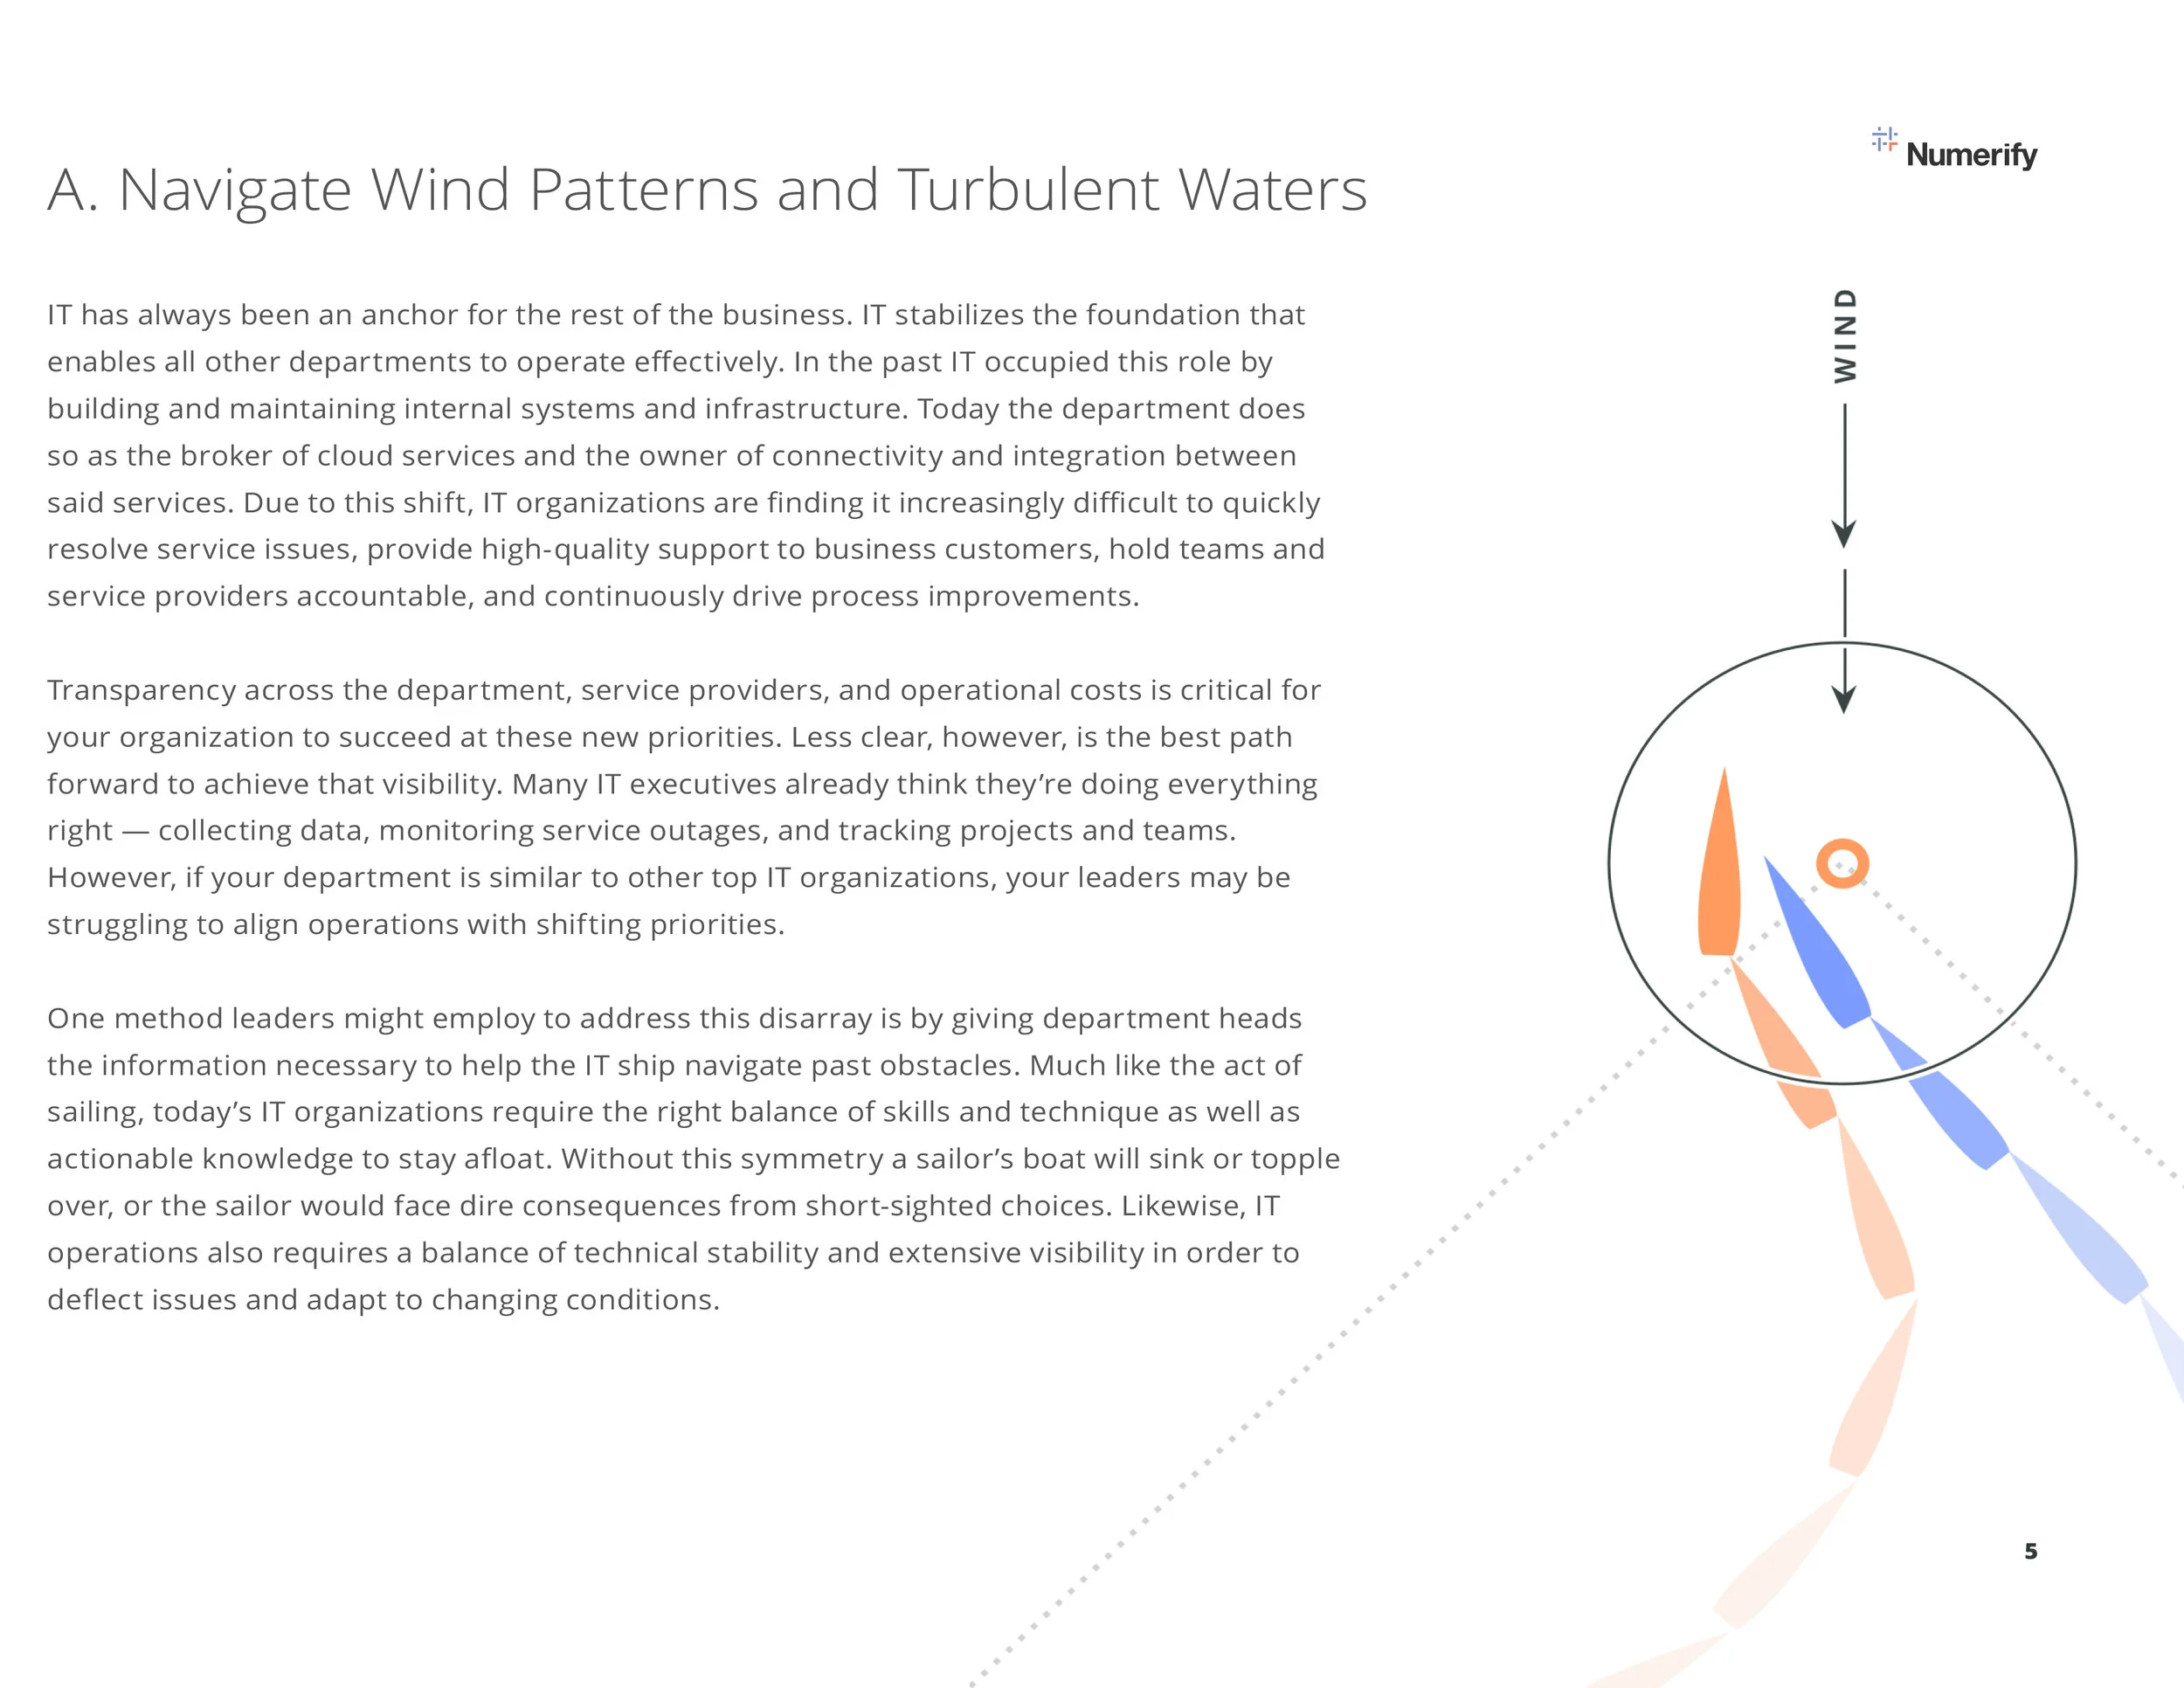
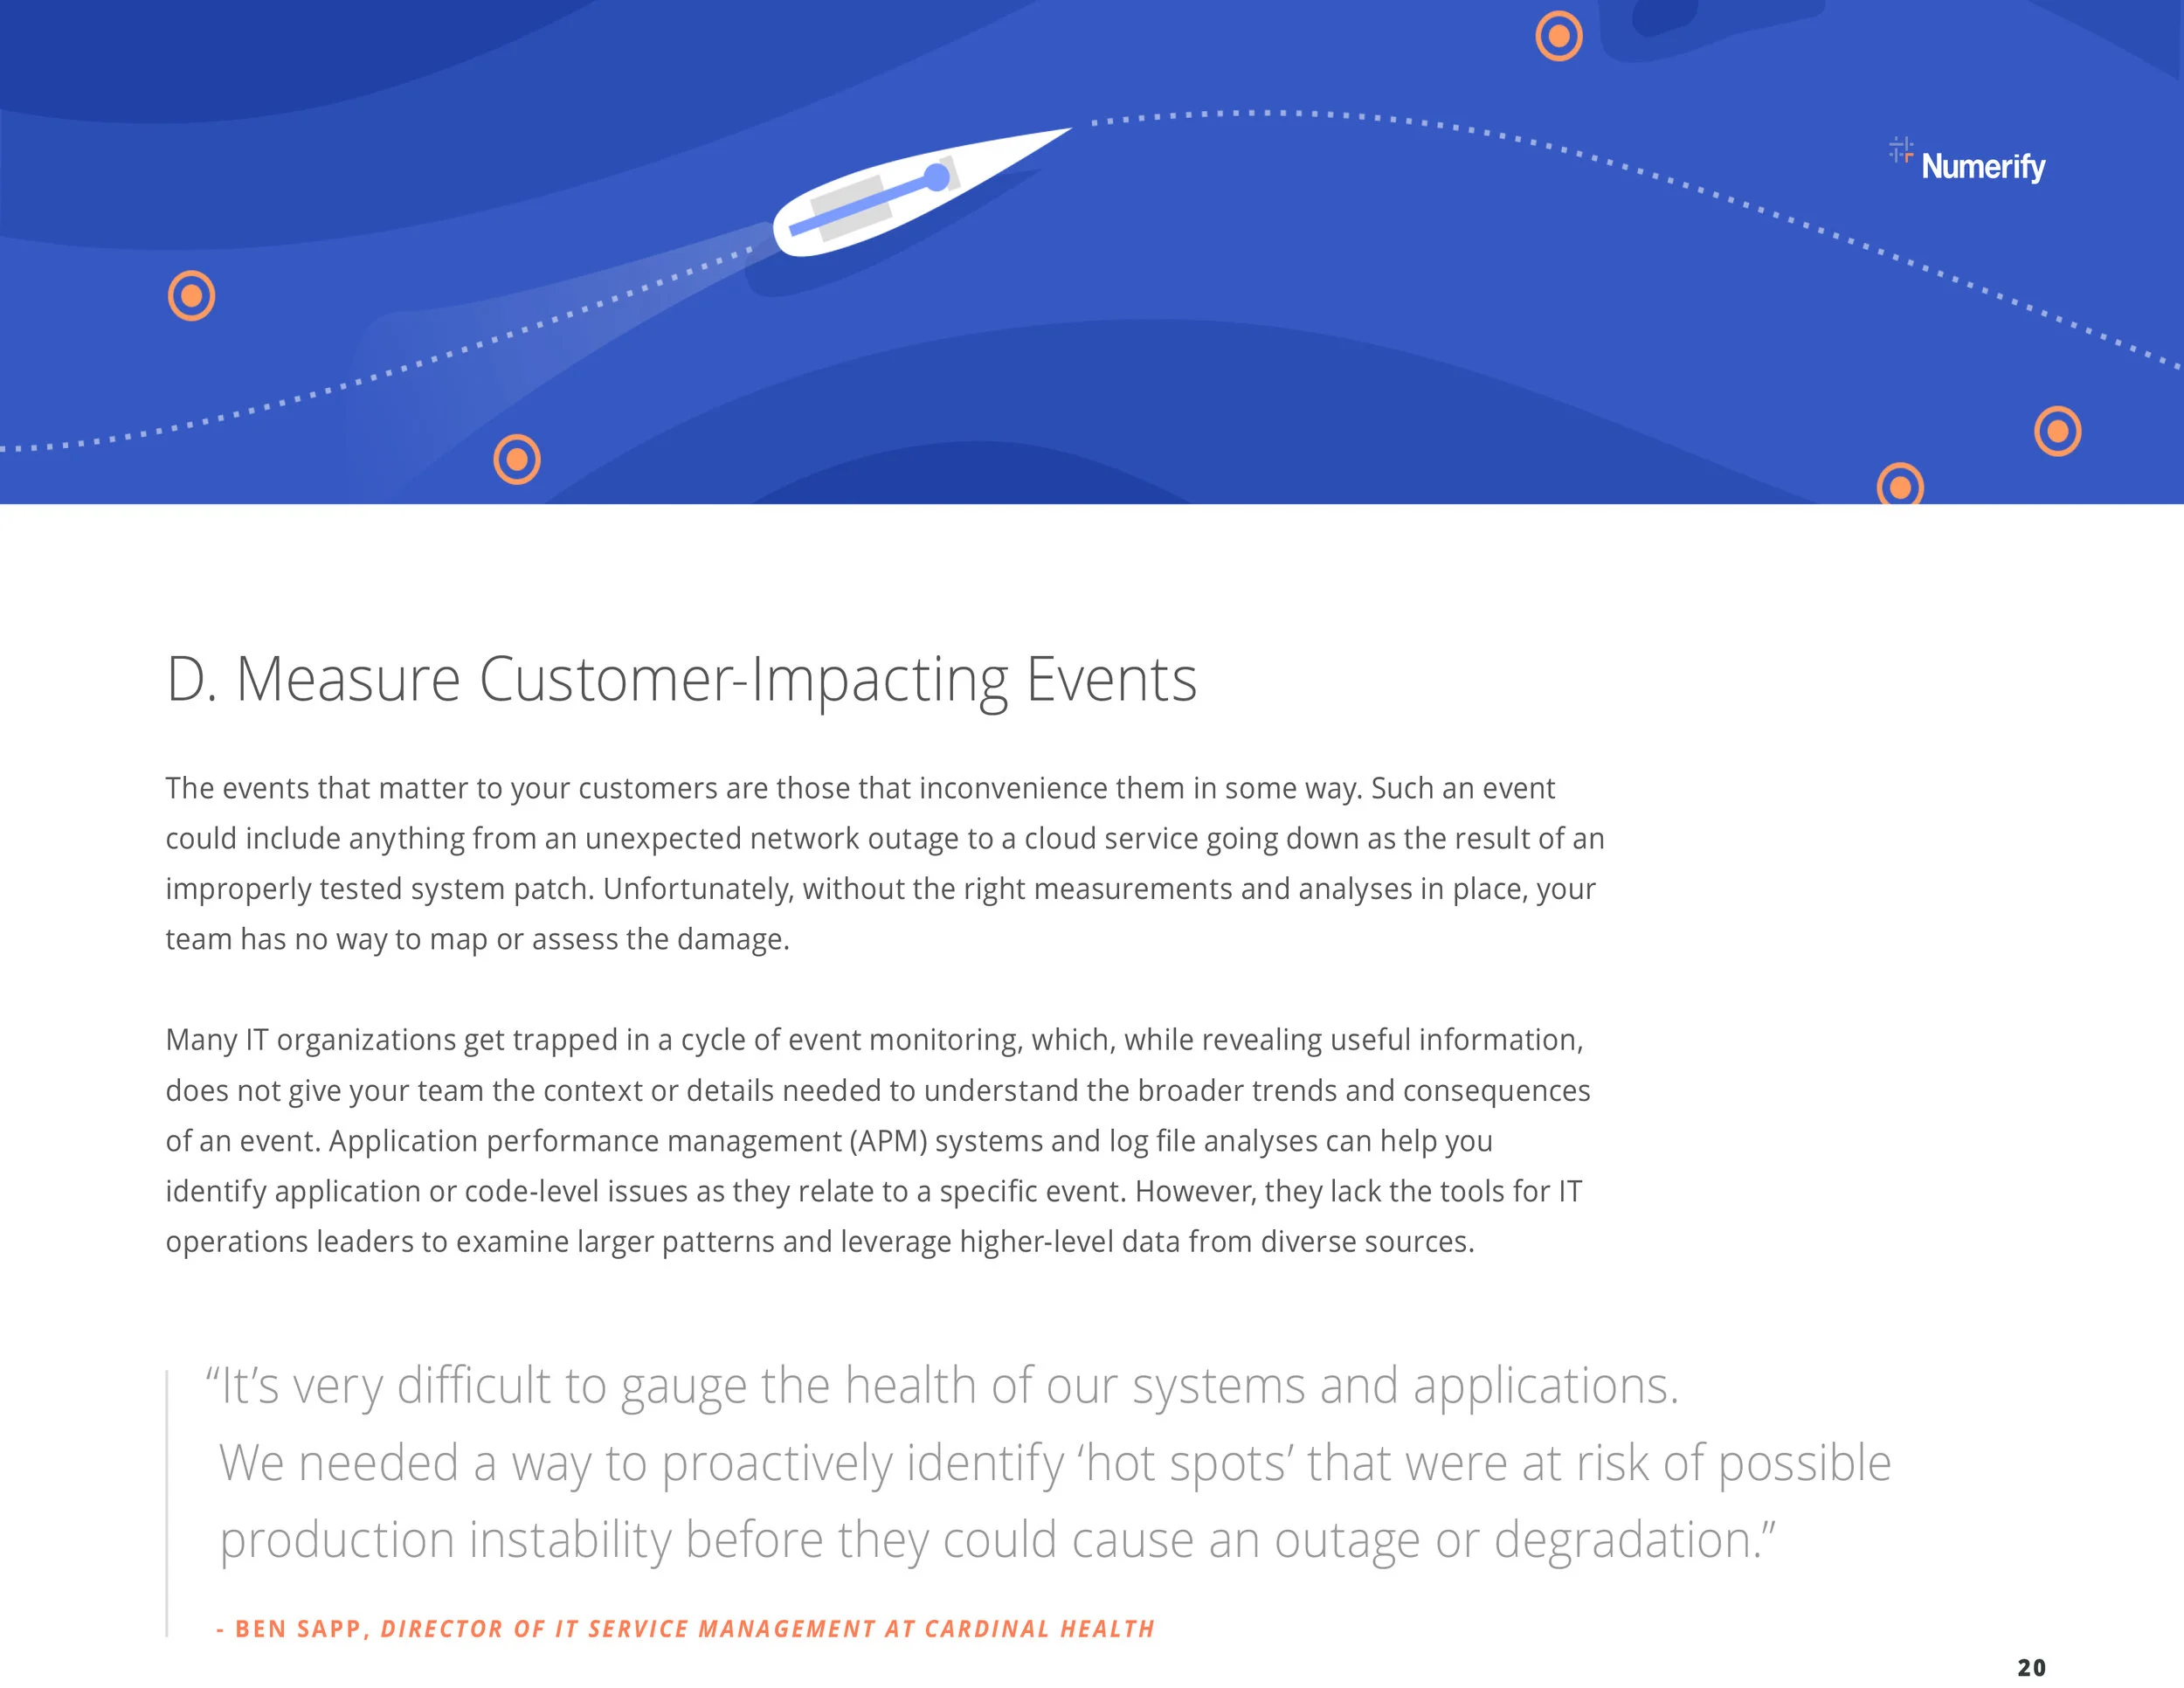
This eBook I created for Numerify highlights the value of analytics for the operational side of IT organizations. IT operations and IT operational leaders are a key user demographic of Numerify's applications, which is why we chose to focus on this subject for the eBook.
I developed the sailing theme by brainstorming various activities with concepts that could overlap IT operations functions. I then crafted the content by drawing parallels between the skills and tools required for sailing, and those needed to effectively operate an IT department. Our designer and I also worked closely to finalize the design.
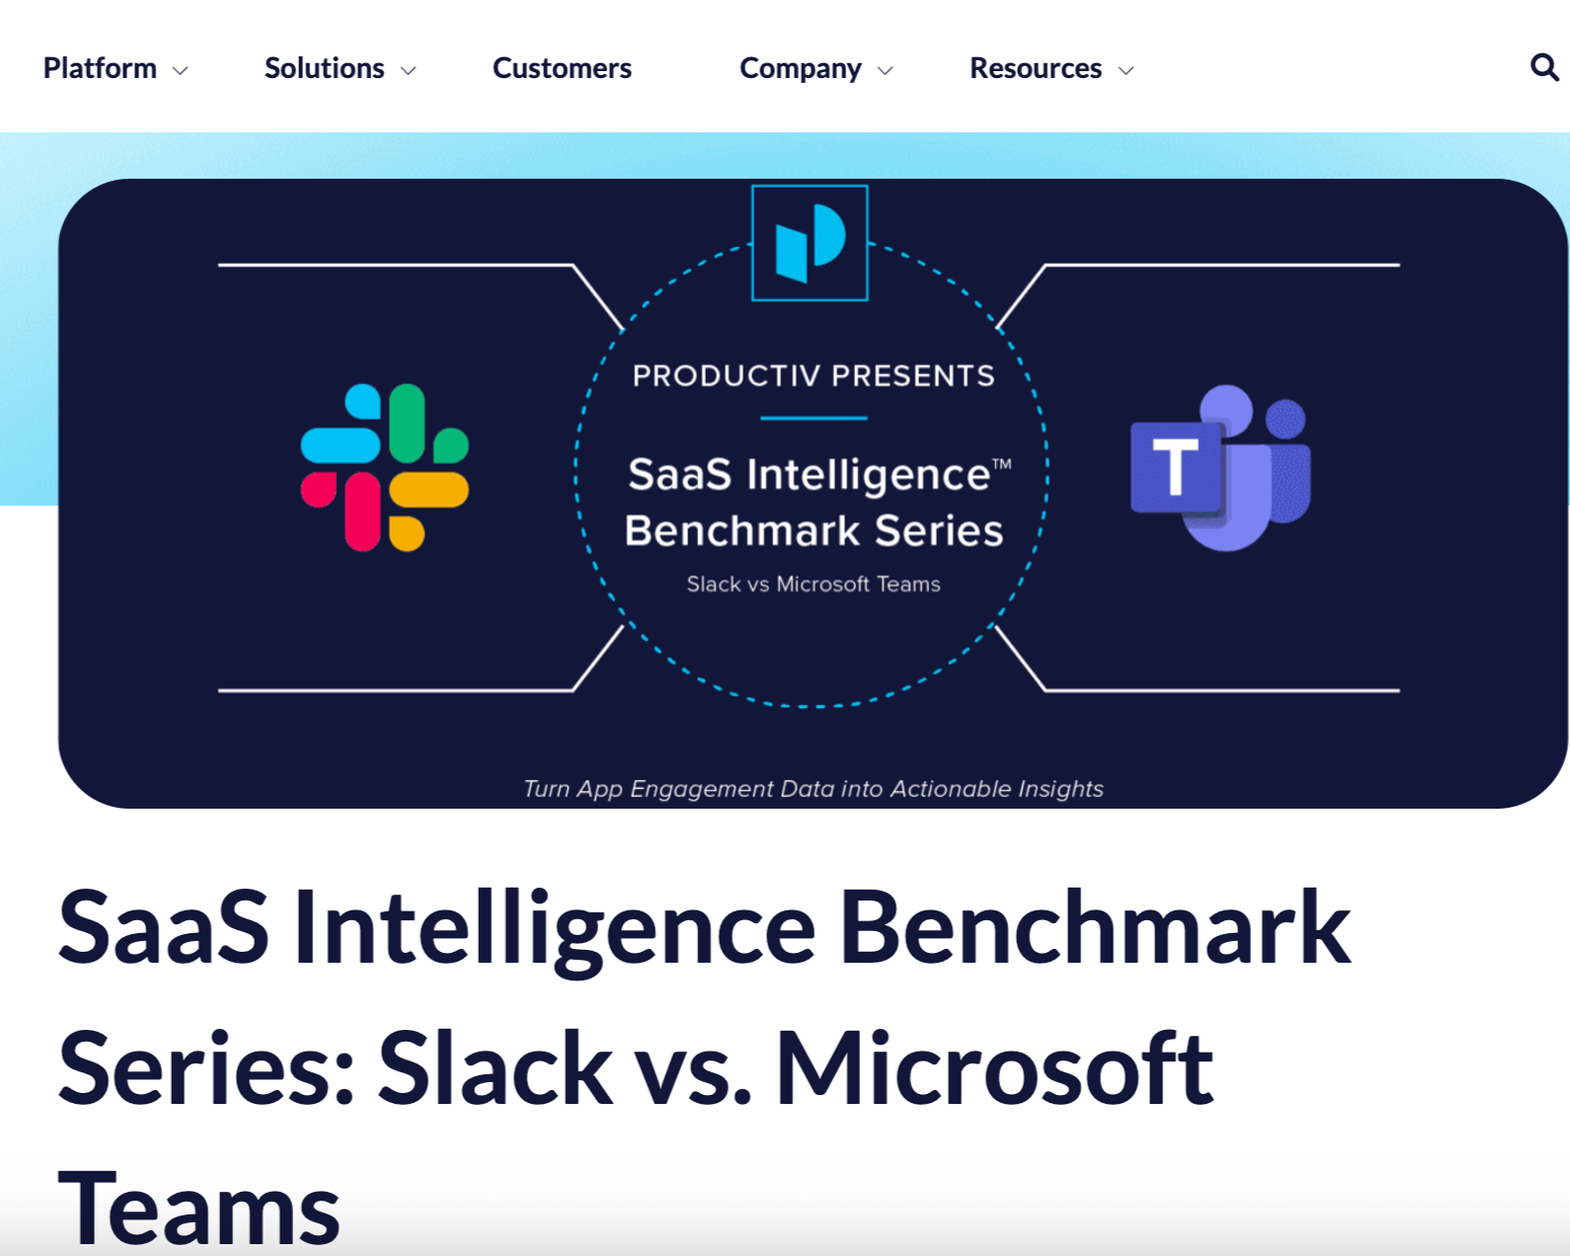
At Productiv, I launched a new blog series analyzing original data to compare app usage. This came about after the largely successful original data report project that I created, The State of SaaS Sprawl in 2021.
This blog series was incredibly successful, driving organic traffic and media coverage as well as strong social engagement. For this blog in the series, I worked with our resident data expert to analyze and compare usage of Slack and Microsoft Teams. I also worked with our designer to develop custom visualizations of the data.
One of my projects at Numerify involved working with a third-party agency to develop a unique marketing asset. As a team we came up with the idea of a record sleeve containing a booklet with “IT’s greatest analytical hits.” In the booklet we feature eight Numerify dashboards that address different IT analytical needs.
I worked directly with the VP of Marketing to select the product dashboards for use, and was responsible for writing all of the copy contained within the booklet. I coordinated extensively with the agency on the design, and provided multiple rounds of feedback on design changes and revisions to ensure the asset looked polished and the concept was executed well.
As the Content Marketing Manager at Productiv, I led the company’s social media strategy across Twitter and LinkedIn. I used Canva and worked with a designer on more complicated visuals to create original social media graphics to foster engagement, awareness, and brand authority.
Under my leadership and strategy, I increased our LinkedIn follower count by 10% QoQ and increased our post engagement rate by 5% QoQ.